
I’ve seen a common story several times. Engineers build a feature, write good unit/functional/integration tests, and trust their CI/CD to rollout changes automatically because they have testing that gates deployments between dev, staging, and prod environments. Those are good practices, no doubt.
But there are things that those tests can miss. The problem shows up when something breaks in production that your tests did not catch. Real production traffic has patterns that are difficult to fully replicate in CI. Traffic patterns may be different in your environments. Third-party integrations can have oscillating latency spikes. When a bug slips through and you are doing full fleet rollouts, 100% of your users are affected the moment a deployment completes.
Why Progressive Deployments?
Progressive delivery, or canary deployments specifically, addresses this by treating a deployment as a controlled experiment rather than an immediate swap. You route a small fraction of traffic to the new version (i.e. 10%), observe what actually happens in production with real users, and then decide whether to continue promoting or roll back. The blast radius of a bad release is capped by the traffic weight. If something is wrong, you are catching it at 10% exposure rather than 100%.
What I’m describing is not novel. Large engineering organizations have been doing weighted traffic splits for years. But there is available open-source tooling out there to enable smaller teams to leverage these types of controlled deployments. In Kubernetes you can now set this up declaratively, without custom infrastructure, and have it automatically roll back based on real observability data.
Argo Rollouts
Argo Rollouts is a Kubernetes controller focused specifically on progressive delivery: it manages ReplicaSets, controls traffic weights at the ingress layer, and runs health checks against your metrics backend throughout a rollout.
You can define a Rollout custom resource that replaces the standard Kubernetes Deployment. The pod spec is identical to what you would write in a Deployment. The difference is in the strategy section, where you define how traffic shifts during an update.
Here is a sample canary strategy for one of my projects:
strategy:
  canary:
    canaryService: ops-hardening-demo-canary
    stableService: ops-hardening-demo-stable
    trafficRouting:
      nginx:
        stableIngress: ops-hardening-demo
    analysis:
      templates:
        - templateName: ops-hardening-analysis
      startingStep: 1
    steps:
      - setWeight: 10
      - pause:
          duration: 30s
      - setWeight: 25
      - pause:
          duration: 60s
      - setWeight: 50
      - pause:
          duration: 60s
      - setWeight: 75
      - pause:
          duration: 30s
      - setWeight: 100
Argo manages two Kubernetes Services throughout any rollout: one pointing at the stable ReplicaSet and one pointing at the canary. Traffic splitting happens at the ingress layer. When a rollout starts, Argo clones your stable ingress and adds two annotations to the copy:
nginx.ingress.kubernetes.io/canary: "true"
nginx.ingress.kubernetes.io/canary-weight: "10"
You do not manage that canary ingress yourself. Argo creates it, updates the weight annotation at each step, and removes it entirely when the rollout completes or is aborted. Your base ingress stays untouched and always points at the stable service.
The startingStep: 1 field tells Argo to begin running the AnalysisRun after traffic reaches 10%, at the first pause. Analysis then runs continuously through the rest of the rollout.
Automated Rollback with AnalysisTemplate
The AnalysisTemplate is where you define what “healthy” means in terms you can actually measure. In my project that means two Prometheus-backed checks that run every 30 seconds throughout the rollout:
apiVersion: argoproj.io/v1alpha1
kind: AnalysisTemplate
metadata:
  name: ops-hardening-analysis
spec:
  args:
    - name: service-name
      value: ops-hardening-demo
  metrics:
    - name: p99-latency
      initialDelay: 30s
      interval: 30s
      failureLimit: 1
      consecutiveErrorLimit: 4
      successCondition: "result[0] < 500"
      provider:
        prometheus:
          address: http://prometheus-kube-prometheus-prometheus.monitoring:9090
          query: >-
            histogram_quantile(0.99,
            sum(rate(http_request_duration_milliseconds_bucket{job="{{args.service-name}}"}[2m])) by (le))
    - name: success-rate
      initialDelay: 30s
      interval: 30s
      failureLimit: 1
      consecutiveErrorLimit: 4
      successCondition: "result[0] >= 95"
      provider:
        prometheus:
          address: http://prometheus-kube-prometheus-prometheus.monitoring:9090
          query: >-
            sum(rate(http_requests_total{job="{{args.service-name}}",status_code=~"2.."}[2m]))
            / sum(rate(http_requests_total{job="{{args.service-name}}"}[2m])) * 100
P99 latency must stay below 500ms and the 2xx HTTP success rate must stay at or above 95%. Both queries use a 2-minute rate window so that there is enough data for a meaningful result even at low traffic volumes rather than returning NaN.
The failureLimit: 1 setting is intentionally strict. One failed metric check rolls back the release. The reasoning is that the cost of an unnecessary rollback is much lower than the cost of letting a degraded build promote to 100% of traffic.
consecutiveErrorLimit: 4 handles a different failure mode: when the Prometheus query itself errors out rather than returning a value that fails the threshold check. This could happen if Prometheus is unreachable or the query is malformed. Without this setting, a broken metrics pipeline could silently pass a bad canary through because it is never actually evaluated.
When the AnalysisRun fails, Argo scales the canary ReplicaSet to zero and shifts all traffic back to the stable service within seconds, no manual intervention required.
The First Deploy
There is a non-obvious behavior worth knowing before you hit it. Argo only runs canary steps when there is an existing stable revision to compare against. For the very first deploy to a cluster, Argo treats it as an initial rollout and skips canary steps entirely. This makes sense because there is nothing to compare it to.
In a long-lived production cluster this usually only affects your initial setup. But if you are running ephemeral clusters in CI, which may be more common for integration testing, every pipeline run is a first deploy and you will never actually exercise the canary progression unless you account for this explicitly.
The Happy Path
During rollout we see the progressive deployment proceed gradually as desired. It starts by rolling out the change to 10% of traffic and pausing movement to the next stage based on the config we set. The pause gives enough time for the metrics to be collected to ensure no failure conditions are being tripped.
We can see this process repeats, as gradually the canary assumes more of the traffic and the stable version is serving less. Eventually, we reach a Healthy status and the canary now becomes the new stable version.
[06:02:31] Status: Progressing  | Canary:   0% | Stable: 100% | Step: 0/9
[06:02:46] Status: Paused       | Canary:  10% | Stable:  90% | Step: 1/9
[06:03:01] Status: Paused       | Canary:  10% | Stable:  90% | Step: 1/9
[06:03:12] Status: Paused       | Canary:  25% | Stable:  75% | Step: 3/9
[06:03:32] Status: Paused       | Canary:  25% | Stable:  75% | Step: 3/9
[06:04:03] Status: Paused       | Canary:  25% | Stable:  75% | Step: 3/9
[06:04:13] Status: Progressing  | Canary:  25% | Stable:  75% | Step: 4/9
[06:04:29] Status: Paused       | Canary:  50% | Stable:  50% | Step: 5/9
[06:04:34] Status: Paused       | Canary:  50% | Stable:  50% | Step: 5/9
[06:05:05] Status: Paused       | Canary:  50% | Stable:  50% | Step: 5/9
[06:05:25] Status: Progressing  | Canary:  50% | Stable:  50% | Step: 6/9
[06:05:35] Status: Progressing  | Canary:  50% | Stable:  50% | Step: 6/9
[06:05:40] Status: Paused       | Canary:  75% | Stable:  25% | Step: 7/9
[06:06:06] Status: Healthy      | Canary:   0% | Stable: 100% | Step: 9/9
You can see from the graph below that the metrics never exceeded the 500ms latency threshold on P99 or went below 95% success rate for the HTTP requests.
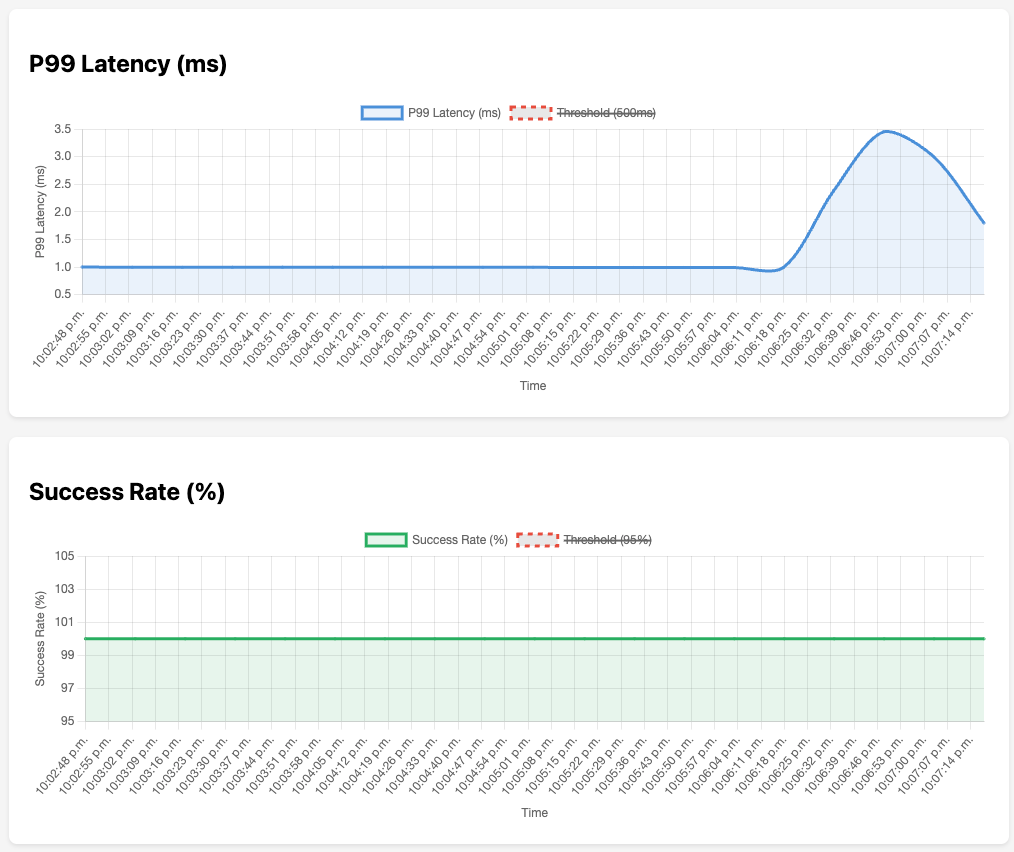
Automatic Rollback
I simulated errors by adding between 200–800ms of latency on each request. The purpose of this code was to see how the deployment would automatically rollback when this failure state was encountered.
func errorInjection(next http.Handler) http.Handler {
 return http.HandlerFunc(func(w http.ResponseWriter, r *http.Request) {
  delay := time.Duration(200+rand.Intn(600)) * time.Millisecond
  time.Sleep(delay)
  ...
  ...
  next.ServeHTTP(w, r)
 })
}
Rerunning the canary deployment shows the rollout stopping midway through once the first thresholds are breached (after the initial delay specified in the config of 30s, to collect sufficient metrics). This automatically rolls back all traffic to the latest stable version.
[23:08:35] Status: Progressing  | Canary:   0% | Stable: 100% | Step: 0/9
[23:08:50] Status: Paused       | Canary:  10% | Stable:  90% | Step: 1/9
[23:09:05] Status: Paused       | Canary:  10% | Stable:  90% | Step: 1/9
[23:09:21] Status: Paused       | Canary:  25% | Stable:  75% | Step: 3/9
[23:09:36] Status: Paused       | Canary:  25% | Stable:  75% | Step: 3/9
[23:09:51] Status: Degraded     | Canary:   0% | Stable: 100% | Step: 0/9
You can see at 23:09 UTC that the P99 latency metric exceeded the threshold. I configured the rollout to immediately roll back on a single metrics scrape that violated either of the 2 conditions I specified. In this case, we can see the status of Degraded and Argo immediately rolled back to the last stable version and paused the rest of the rollout. A win for progressive deployments!

Simulating Load
Low-traffic services may suffer from a lack of meaningful data to faciliate the progressive deployment metrics. For example, if I have a service that has very low traffic, my queries that measure P99 latency may only have a few samples over a 2min sliding window. This can lead to false positive or a total lack of data in some cases.
A way to mitigate this is sythentics. Simulating traffic using scripts and other jobs to test out various code paths and replicate production or peak traffic as much as possible.
Conclusion
The initial setup for canary deployments using Argo does involve some setup. You need the controller installed, Prometheus scraping your pods, the Rollout resource replacing your Deployment, and the AnalysisTemplate wired to the right metrics. But once that scaffolding is in place, what you are left managing is the step schedule and the metric thresholds, both of which are straightforward to tune.
The bigger shift is in how you think about deployments. Instead of shipping a change and hoping your pre-production testing was sufficient, you are making a small yet observable bet in production and letting real traffic inform whether it was a good one. For most services with real users, that is a much more defensible way to ship.