Stop over-engineering your observability stack. Start with what you already have
Overview
It’s easy to get overwhelmed by all of the advice that exists to instrument your systems with telemetry. Vendors and experienced practioners will tell you that you have to have the 3-pillars of observability supported (metrics, traces, and logs).
The truth is, most applications start with logs and you can do a lot with just that. This post will show you how to create log-based alerts since logs are the most common telemetry. You probably already have these in your application.
This post will provide a step-by-step demo of how to setup log-based alerting. I’ll use open-source tools exclusively. You can find the repo to run the setup yourself here.
OpenSearch : an open-source analytics engine that supports telemetry like logs + metrics
fluentbit: lightweight telemetry processor and forwarder
Docker: popular containerization technology
Container Setup
We’ll first start out by defining the 3 containers to run with a docker-compose file: opensearch, opensearch dashboards, and fluentbit. Please note: utilize your own admin password and leverage a secrets management platform like HashiCorp Vault to store your passwords so you do not commit them into your code base. The code below is just for demo purposes.
services:
  opensearch:
    image: opensearchproject/opensearch:2.12.0
    container_name: opensearch
    environment:
      # Run as single-node cluster (no clustering overhead)
      - discovery.type=single-node
      # Required for OpenSearch 2.12+
      - OPENSEARCH_INITIAL_ADMIN_PASSWORD=YourStr0ng!Password
      # Limit JVM heap to 1GB (adjust based on available memory)
      - "OPENSEARCH_JAVA_OPTS=-Xms1g -Xmx1g"
    ports:
      # REST API
      - 9200:9200
    volumes:
      # Persist index data across restarts
      - opensearch-data:/usr/share/opensearch/data
    healthcheck:
      test: ["CMD-SHELL", "curl -sk -u admin:YourStr0ng!Password https://localhost:9200/_cluster/health || exit 1"]
      interval: 30s
      timeout: 10s
      retries: 5

  opensearch-dashboards:
    image: opensearchproject/opensearch-dashboards:2.12.0
    container_name: opensearch-dashboards
    ports:
      # Web UI
      - 5601:5601
    environment:
      # Point to the OpenSearch container
      OPENSEARCH_HOSTS: '["https://opensearch:9200"]'
    depends_on:
      opensearch:
        # Wait for OpenSearch to be healthy before starting
        condition: service_healthy

  fluent-bit:
    image: fluent/fluent-bit:latest
    container_name: fluent-bit
    volumes:
      # Mount config files
      - ./fluent-bit.conf:/fluent-bit/etc/fluent-bit.conf
      - ./parsers.conf:/fluent-bit/etc/parsers.conf
      # Mount logs directory - write logs here to ship to OpenSearch
      - ./logs:/var/log/app
    depends_on:
      opensearch:
        condition: service_healthy
fluentbit will write logs to OpenSearch and then we can login to the dashboard containerto see our logs + alerts in the UI.
The fluent-bit.conf also contains config for fluentbit to know where to locate the logs and forward them to OpenSearch. In the config below, we are looking for logs at /var/log/app/*.log and they are being forwarded to opensearch at port 9200 (which is where our opensearch instance is running at). The docker compose volume mount is at ./logs:var/log/app since that is a standard Linux convention.
[SERVICE]
    Flush        5
    Log_Level    info
    Parsers_File parsers.conf

[INPUT]
    Name         tail
    Path         /var/log/app/*.log
    Tag          app.logs
    Parser       json
    Refresh_Interval 5

[OUTPUT]
    Name         opensearch
    Match        *
    Host         opensearch
    Port         9200
    HTTP_User    admin
    HTTP_Passwd  YourStr0ng!Password
    Index        application-logs
    Logstash_Format On
    Logstash_Prefix app-logs
    tls          On
    tls.verify   Off
    Suppress_Type_Name On
You can run these containers that are defined in the repo I created by using docker compose up -d
Generate Logs
Once you have the containers running, you can generate some sample logs that will automatically get shipped to OpenSearch.
# Batch of logs (to trigger High Error Rate Monitor)
for i in {1..8}; do
  echo '{"timestamp":"'$(date -u +%Y-%m-%dT%H:%M:%S.000)'","level":"ERROR","message":"Test error '$i'","service":"my-app"}' >> logs/app.log
done
View the Logs
Once these are generated and forwarded to OpenSearch, we can log into the dashboard using the defined creds at localhost:5601

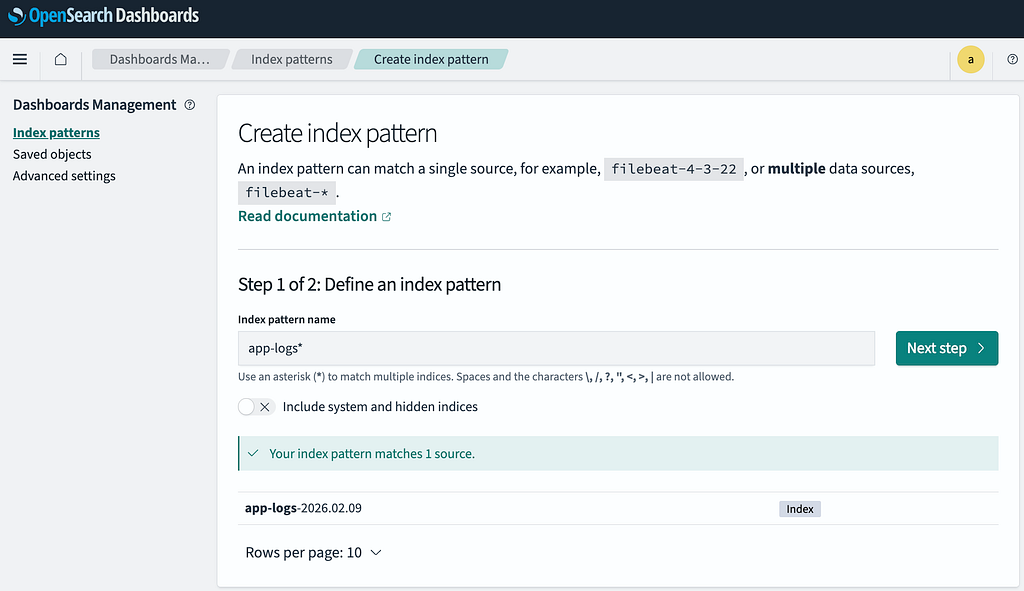
Navigate to Discover -> Create Index Pattern and input a regex like app-logs* to match the logstash prefix used by fluentbit. You’ll also be prompted to pick a time field (you can select @timestamp).
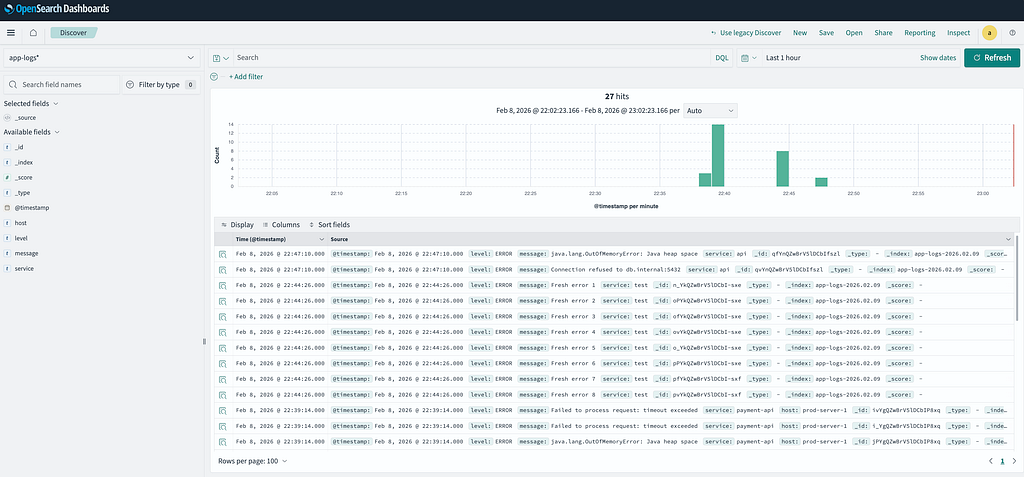
You can now navigate to Discover to view your logs!
Configure Alerts
Now that we have logs flowing into our OpenSearch instance, we want to configure alerts that are based on these. You can do this by defining a monitor, which can detect anomalies in your data on a continuous basis and allow you to configure multiple alerts that utilize those signals.
In the UI dashboard you can navigate to Alerting -> Monitors -> Create Monitor to configure your own using the wizard and also using the query editor. Below is a monitor I have written that can be copy/pasted using the query editor: It looks at the last 5min and searches for the key/value pair level:ERRORto match any logs that have an error level defined.
{
"size": 0,
"query": {
"bool": {
"must": [
{
"range": {
"@timestamp": {
"from": "now-5m",
"to": "now",
"include_lower": true,
"include_upper": true,
"boost": 1
}
}
},
{
"term": {
"level.keyword": {
"value": "ERROR",
"boost": 1
}
}
}
],
"adjust_pure_negative": true,
"boost": 1
}
},
"aggregations": {
"error_count": {
"value_count": {
"field": "_id"
}
}
}
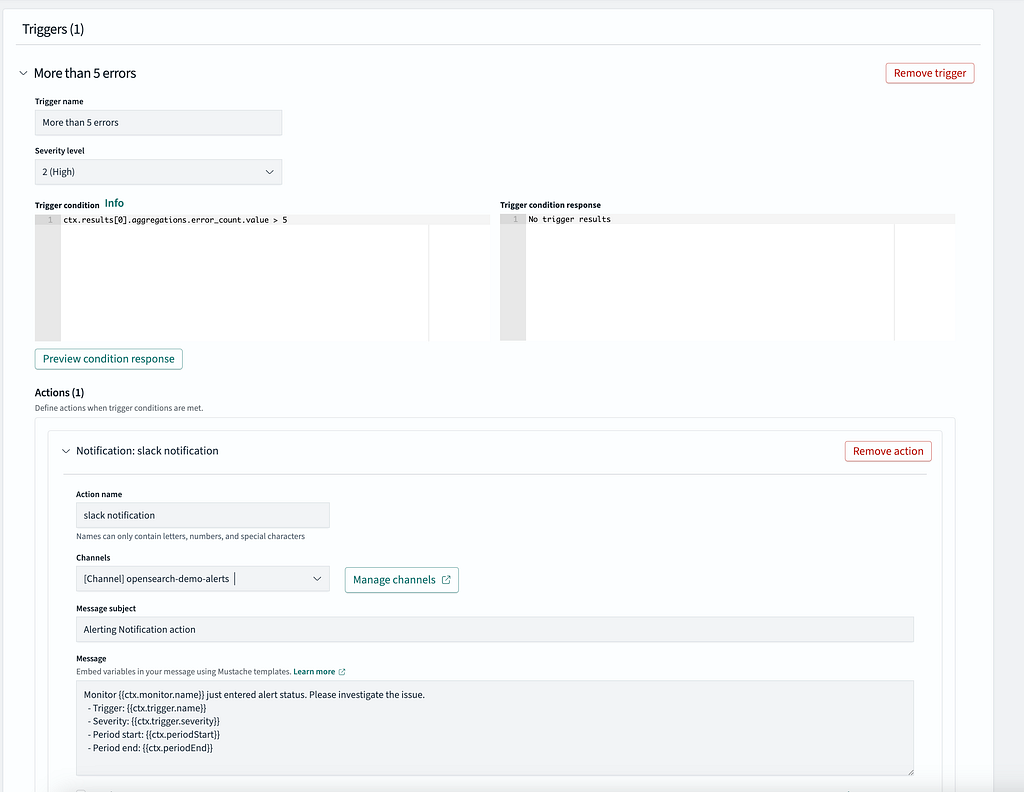
}We can define 1 or more triggers for each of these monitors that will define various thresholds and severities that go along with that. In the screenshot below, this will fire with a SEV-2 severity whenever ≥ 5 errors occur within the 5 minute window utilized by the monitor:
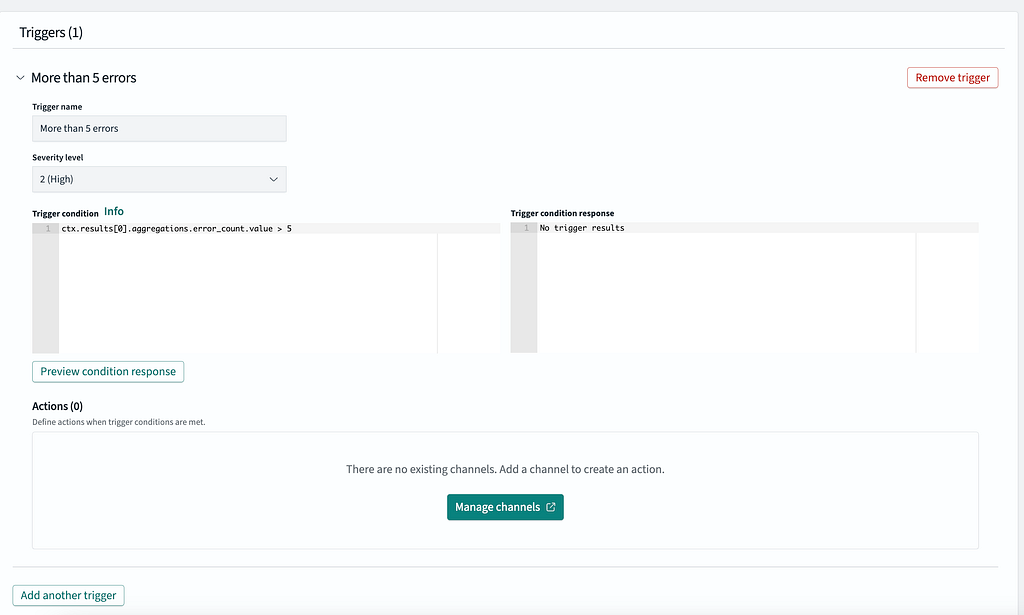
Based on the data, we can see that this alert fired 2x for me, once at 22:40 UTC and the other time at 22:44 UTC


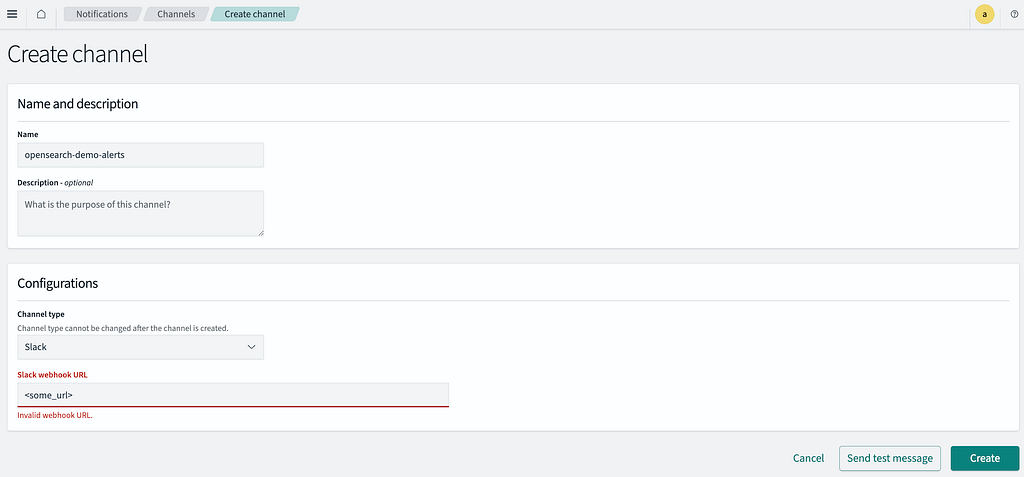
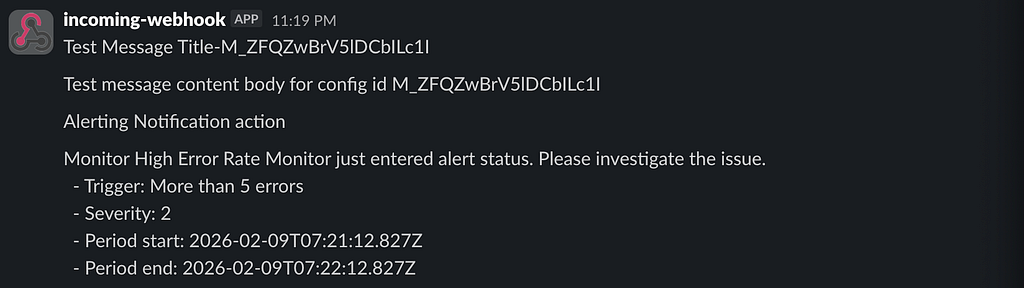
You can also have the alerts forwarded to Slack. Go to the OpenSearch dashboard and navigate to Notifications. You can provide a Slack webhook url that is configured to forward alerts to a channel you provided when you setup the webhook.
I can then update my monitor trigger to include an action to send the notification to Slack.
After sending a test alert, I regenerated some additional error logs using the scripts provided in the repo and tada! We have our slack alert.
Conclusion
Observability can get complex and expensive very quickly, but getting started with it isn’t too bad when you already have some telemetry like logs. Logs are a great place to start with and there are great open-source tools like OpenSearch + fluentbit that are powerful and can provide alerting out-of-the-box. This entire demo was hosted on my local machine and I didn’t pay a dime for any of it.
Of course, in production you likely will need to host these containers somewhere or possible pay for a managed service if you don’t want to self-host yourself. Still, the main point is that you can deliver a lot of observability right away without having to configure separate systems for metrics + traces.
With observability, start simple and only layer on complexity when it’s warranted.